

Baby Growth Chart Calculator
Fill out your baby's details*:
This is a mandatory field.
This is a mandatory field.
This is a mandatory field.
This is a mandatory field.
How It Works
To get started, enter your little one’s sex, age, and latest measurements—weight, height, and head circumference. The baby growth chart calculator will then map those details against U.S. growth standards for children of the same age and sex.
This tool uses data from the World Health Organization (WHO) Growth Standards to give you a snapshot of where your baby lands on the growth curve. Whether you're looking for a baby weight percentile calculator or a baby growth curve calculator, this tool offers reliable, research-based insight from newborn to age 2.
Tracking these changes between checkups, like at the 2-month, 9-month, or 1-year well-baby visit, can help you stay informed and better prepared for your next pediatric appointment.
What is a Growth Chart Calculator?
Babies grow quickly, and a lot can change in just a few weeks. One way to track their development is by using a baby growth chart calculator, which helps you monitor your little one’s size over time.
Also known as a baby percentile calculator, this tool maps your baby’s measurements—like weight, height, and head circumference—onto a growth chart. This visual shows how your baby compares to other children of the same age and sex, revealing trends and growth percentiles.
Our calculator follows the WHO Growth Standards—an internationally trusted reference used by healthcare providers to track healthy growth in babies and infants.
How is My Baby’s Growth Chart Calculated?
To calculate your baby’s growth chart, just enter a few up-to-date details into the baby growth chart calculator: age, sex, weight, height, and head circumference.
From there, the tool automatically maps your baby’s stats onto a growth chart—no math required. You’ll instantly see where your baby falls on the curve compared to others their age and sex, using trusted international standards.
This percentile calculator for babies makes it easy to spot patterns in your baby’s development. Whether you’re checking weight, length, or head size, the tool does the number crunching for you.
Also, if you want to better understand the different types of growth charts and how growth percentiles are calculated, you can check out our comprehensive guide to growth charts and percentiles.
How Do I Read My Baby’s Growth Chart?
After entering your little one’s details, the baby growth chart calculator plots their data automatically. The results appear as a graph showing how your baby compares to others of the same age and sex.
The chart adjusts depending on what you’re tracking—weight, height, or head circumference. On the graph, the horizontal axis shows age in months, and the vertical axis shows the selected measurement. Your baby’s result is shown as a dot.
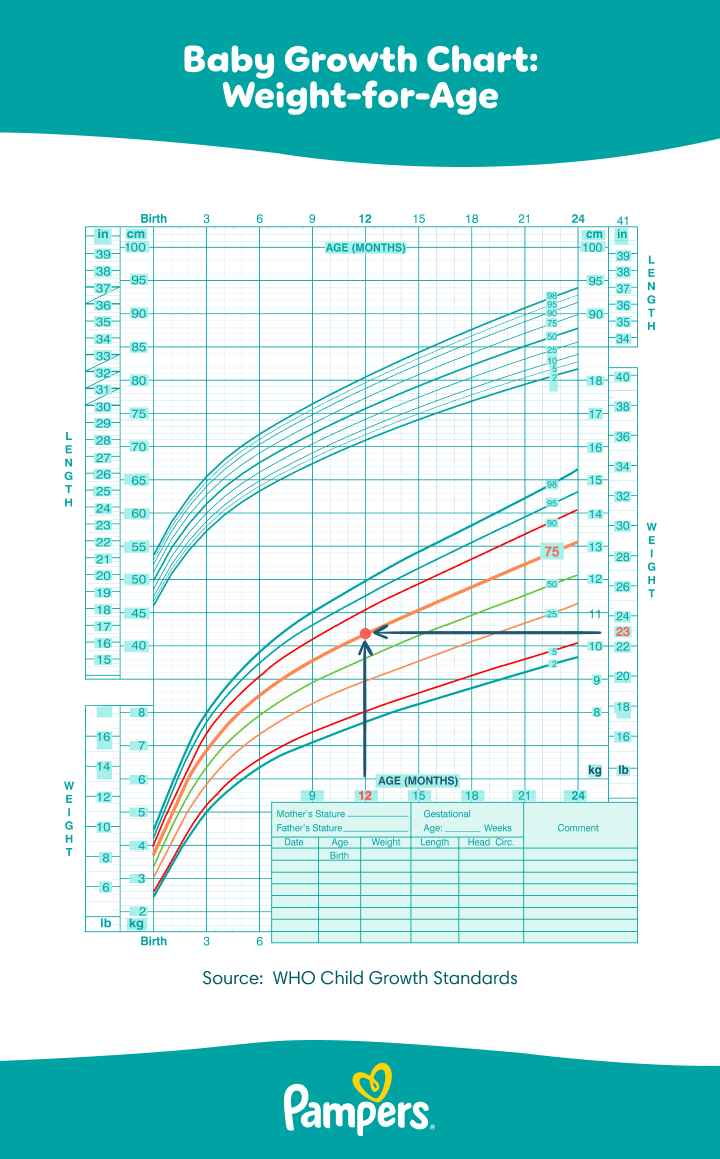
Curved lines on the chart represent growth percentiles. The number next to each line shows what percentage of babies fall below that measurement; for example, the 50th percentile is the average.
To read it, just find your baby’s dot and see which curved line it’s closest to. That tells you their percentile for that measurement.
And if it sounds confusing, don’t worry! The tool includes a simple summary at the bottom so you can understand your little one’s results immediately.
Why is the Growth Chart Calculator tool useful
Our baby growth chart lets you track your child’s growth from birth to 24 months in one simple tool.
Healthcare providers often use baby percentile calculators during checkups to monitor how your little one is growing over time. These charts help identify patterns and track growth percentiles, offering insight into your baby's development compared to other children their age.
Using this infant percentile calculator at home gives you a helpful snapshot between visits. While the tool can highlight trends, remember that growth is rarely linear. Factors like growth spurts, genetics, and activity all play a role in how your baby grows.
If you notice a sudden shift in your baby’s growth curve or percentile, it’s a good idea to bring it up at your next checkup—such as during the 18-month well-baby visit. Regular monitoring with your provider is the best way to stay informed about your baby’s health.
What are growth percentiles and why do I need to know about them?
Every baby grows at their own pace, but growth percentiles help give context to that development. Healthcare providers use these numbers to see how your little one compares to others of the same age and sex, and whether their growth pattern is on track.
For example, if your baby is in the 25th percentile for height, that means they’re taller than 25 out of 100 babies, and shorter than 75. If your baby weighs 20 pounds at 10 months and lands in the 50th percentile, they’re right in the middle—half of babies their age weigh more, and half weigh less.
These percentiles are calculated using standard data, like those found in the WHO Growth Standards, and are a key part of how tools like this percentile calculator baby weight chart work.
Understanding what percentile your little one is in can offer insight, but it’s only part of the picture. If you ever have questions about your baby’s growth or percentile, it’s best to consult your healthcare provider.
What should I do if my baby’s values fall outside of an average percentile range
It’s completely normal to feel concerned but try not to worry. Babies grow at different rates, and growth percentiles are just one piece of a much bigger picture.
Many things influence growth—like genetics, feeding patterns, and activity, and it’s common for a baby to shift percentiles over time. What matters most is the overall trend, not a single data point.
If something feels off or you have questions, speak with your healthcare provider. They’ll help you understand what’s typical for your baby and guide you through the next steps if needed.
*Input details of your baby’s last measurements. **Source: World Health Organization